

A Core Web Vitals analysis for top websites should turn raw performance reports into engineering decisions: what is failing, why it fails, and how to prove the fix worked. For web developers and SEO professionals, Core Web Vitals Analysis means connecting field data with lab evidence, then running targeted experiments that validate real user impact. In 2026, reporting still relies on the split between real-world field signals and controlled lab testing. That split is exactly why “analysis” must map measurements to causes, not just chase score labels.
You will learn how to interpret LCP, INP, and CLS, then isolate the dominant contributors across key templates and device classes. You will also get a triage path that prioritizes fixes by user impact and confidence. Finally, you will leave with a measurement plan that prevents vanity improvements and catches regressions after releases.
Contents
- 1 How a Core Web Vitals analysis should look for top websites
- 2 Core Web Vitals analysis framework that matches how top websites are measured
- 3 Mapping real-user metrics to engineering work for LCP, INP, and CLS
- 4 A decision path to prioritize fixes based on impact and confidence
- 5 Common pitfalls and misconceptions when interpreting Core Web Vitals Analysis results
- 6 Comparing analysis options and tooling approaches for performance diagnostics
- 7 Edge-case scenarios top websites must account for in Core Web Vitals Analysis
- 8 Designing a measurement plan to validate Core Web Vitals improvements in 2026
- 9 How do I deliver Core Web Vitals Analysis insights to stakeholders across teams?
- 9.1 What does “top websites” Core Web Vitals analysis typically deliver to engineering teams?
- 9.2 How do you connect field Core Web Vitals results to a specific code change?
- 9.3 Should we trust lab data more than real-user data when optimizing LCP and INP?
- 9.4 Why do my improvements show in testing but not in real-user metrics?
- 9.5 How can I analyze CLS caused by third-party embeds without breaking layout for users?
- 9.6 What’s the best way to prioritize Core Web Vitals fixes when multiple metrics are failing at once?
- 9.7 Which Core Web Vitals scenarios should be tested on the homepage versus templates and article pages?
- 9.8 How do A/B tests and feature flags affect Core Web Vitals analysis and validation?
- 9.9 What data do you need to perform a reliable Core Web Vitals analysis if you don’t have strong RUM coverage?
- 9.10 How often should we rerun Core Web Vitals analysis for a production website in 2026?
- 10 Conclusion: turn Core Web Vitals signals into validated engineering actions
How a Core Web Vitals analysis should look for top websites
A Core Web Vitals analysis should deliver more than a checklist of “good” or “poor.” For top websites, it should produce a prioritized backlog with evidence, hypotheses, and a verification plan. That output lets engineering, frontend, and SEO teams act without debating what the metrics really mean.
Start with a structured breakdown of each metric. For example, list LCP failures by candidate element, INP issues by interaction type, and CLS problems by layout shift source. Then rank severity using thresholds, but also tie each issue to user-visible friction. This matters because a label alone does not explain what users experience or which code path causes the issue.
Next, connect field and lab views. Field signals reflect real users on real networks, while lab tests reproduce issues under controlled conditions. Google describes this approach in its web performance documentation, including how metrics are reported for real users and lab runs: Web Vitals. When you combine both, you can validate whether a suspected cause actually shows up where it matters.
Finally, design the analysis so it is reproducible across teams. Include the page scope, the navigation flow, and the segment filters you used. Also record the page variants tested, because top sites often run experiments and feature flags. This avoids a common mistake where teams fix one template, then see no field improvement because the original problem lived in a different template or route.
For practical delivery, most organizations use an “evidence pack.” It usually includes session examples, trace views, and a ranked list of likely root causes. If your site has limited RUM coverage, you still need a plan for lab reproduction and instrumentation upgrades. The tradeoff is time and certainty, but the workflow remains the same: observe, hypothesize, test, and verify.
Core Web Vitals analysis framework that matches how top websites are measured
Top websites are measured in ways that can differ from how teams browse the site manually. A strong framework reflects the measurement pipeline, especially the split between field data and lab testing. This is the foundation for Core Web Vitals Analysis that leads to durable improvements.
In the field, the goal is to summarize real user sessions across devices and networks. In the lab, the goal is to reproduce behavior in a repeatable environment. The practical work is to align the “what” across both: the metric, the element or interaction, and the phase of loading or navigation. If you skip alignment, you risk chasing an issue that improves in the lab but does not show up for users.
You should also interpret thresholds as context, not a finish line. “Needs improvement” can include multiple causes, from render delays to network stalls. Therefore, map each metric to UX effects. LCP delays can mean users wait to see the main content. INP problems can mean clicks feel laggy. CLS issues can mean content jumps while users read or interact.
Then define the scope for analysis. For top sites, “homepage only” rarely captures the real problem. A better scope includes the primary templates, such as listings, article pages, and key landing pages that drive traffic. In addition, include logged-in or consent-gated flows when those affect loading and scripts.
A common edge case is when a failure concentrates on only certain device classes. For example, low-end Android devices may show worse LCP because decoding and render timing differ. If you only review desktop lab runs, your hypotheses may never trigger. Another common mistake is analyzing only one URL. Top sites often have different templates, ad slots, or personalization blocks that change the dominant contributors.
Finally, format your deliverable for cross-functional decision making. Engineering needs code-level signals and trace evidence. SEO often needs page scope clarity and template mapping to search landing URLs. Product or growth needs a plan that respects experiments and release risk. A shared deliverable prevents “fix ping-pong” where changes get reverted because they break user journeys.

Mapping real-user metrics to engineering work for LCP, INP, and CLS
You can map each Core Web Vitals metric to a concrete engineering problem by focusing on what users feel during the load and interaction. This is where Core Web Vitals Analysis becomes actionable. It turns LCP, INP, and CLS into engineering work that teams can assign and validate.
LCP reflects when the main content becomes visible. Typical drivers include slow server response, heavy hero markup, render-blocking CSS, or late discovery of key media. In practice, your analysis should inspect candidate LCP elements using trace views and resource timing. Look for gaps between request, response, and render, and confirm whether the element appears earlier for some sessions or devices.
INP focuses on responsiveness during user interactions. It is influenced by long tasks, heavy JavaScript execution, and event handlers that block the main thread. During analysis, identify which interaction types correlate with failures. For example, filtering, navigation taps, or search submissions often differ from simple scrolling.
CLS measures unexpected layout movement. Common causes include late-loading images, dynamic ad containers, and injected banners that do not reserve space. Instrumentation should help you find the exact shift elements. Then connect them to your rendering strategy for media, third-party widgets, and personalization.
A practical data-to-hypothesis mapping needs triangulation. Use session examples from field reports, then reproduce in lab conditions that match the failing segment. Compare the trace timeline to performance profiles and layout shift sources. This helps avoid a misconception where teams assume “one metric equals one fix.” In reality, changing CSS delivery can improve CLS while worsening INP due to different main-thread work patterns.
Route transitions and single-page app navigation also need special treatment. Metric attribution can mislead you when dynamic content updates occur after navigation. Therefore, the analysis should isolate the navigation scenario: full page load, SPA route change, or user-triggered rerender. A common misattribution occurs when the trace boundary captures the wrong “start” moment, so the dominant contributor seems different than it really is.
During instrumentation planning, target the artifacts that explain causality. For LCP, review element timing, render delays, and key request chains. For INP, inspect long tasks, input delay contributors, and event handler timelines. For CLS, track layout shift sources and confirm space reservation for late content.
A decision path to prioritize fixes based on impact and confidence
You should prioritize Core Web Vitals fixes using both impact and confidence, not only severity labels. For top websites, many issues can appear at once. A decision path helps teams reduce the biggest user friction first while keeping certainty high enough to justify engineering effort.
Start by confirming which pages and segments are failing. Then quantify severity and dominant contributors per template, not just across the domain. After that, identify the likely drivers using evidence from field sessions and trace breakdowns. This matters because the highest-severity label might come from a small traffic segment or a rare device class.
Next, choose experiments based on user impact weighting. Use traffic and funnel importance to score opportunity. For example, a product listing page that drives conversion should outrank an internal search page with low visibility. Then add difficulty and risk. A change that touches rendering and routing may require more careful rollout than a CSS adjustment.
Confidence should reflect triangulation. It increases when field evidence, lab reproduction, and code-level signals agree. It decreases if you only have dashboard patterns without trace confirmation. A common mistake is to trust a single reproduction run, then ship a fix that fails under different device or network conditions.
You also need a plan for ambiguous signals. Borderline thresholds can flip after small changes in traffic mix or caching behavior. Mixed device classes can hide where the problem actually concentrates. Therefore, treat borderline cases as “needs clarification,” and run targeted validation on the failing segment.
Fix verification validity is a key nuance for top websites. You must confirm the improvement on the same experience definition. That includes the same template variant, navigation path, and segment. If the deployment rollout changes your user mix before field data stabilizes, your results may look inconsistent even when the fix helped.
Finally, document tradeoffs when multiple metrics fail. For example, deferring non-critical JavaScript can help INP, but it may change how and when layout assets appear. A good decision path keeps a running risk log so each experiment has a clear “what might break” section.
Common pitfalls and misconceptions when interpreting Core Web Vitals Analysis results
Many teams misread Core Web Vitals Analysis results by treating metrics as independent facts. In reality, they interact with caching, routing, and third-party content. Understanding the pitfalls helps you avoid spending weeks on a change that does not improve user experience.
A major misconception is that lab improvements guarantee better field outcomes. Lab tests are repeatable, but they may not match device capability, network latency, or real user interactions. Therefore, you must validate with field data after rollout. Even then, you should expect delays because field samples need time to accumulate.
Another pitfall is analyzing only one URL or one navigation pattern. Top websites often have multiple templates and distinct interactions. If the failing experience happens only on a logged-in flow or a special landing page, a narrow test will miss the dominant contributor.
CLS can also be misattributed. For example, a banner or ad slot may look like the cause during manual browsing, but the actual shift might come from a late-loaded image or injected widget elsewhere. To confirm, use layout shift sources and inspect the elements that moved. Then map those sources to the rendering lifecycle in your code.
Measurement hygiene is another common failure mode. If trace boundaries are misaligned, you can attach the wrong timeline to the metric. Duplicate event timing or missing lifecycle markers can distort INP conclusions too. As a result, teams may “fix” an issue that is actually an instrumentation artifact.
An edge case involves performance improvements that change user journeys. For example, optimizing redirects or consent loading may alter which metrics get attributed to which navigation. That can make results appear worse or better without a true regression. In these cases, the analysis must update its scope definition and confirm that the same user experiences are being compared.
Finally, beware of sampling and attribution changes over time. Traffic can shift due to campaigns, seasonality, or device mix. If you do not segment results, a change might look like progress even when a different audience is now being measured. Segmenting keeps your conclusions tied to real user experience, not shifting averages.
Comparing analysis options and tooling approaches for performance diagnostics
Teams can analyze Core Web Vitals in different ways, depending on data availability and engineering maturity. Each approach has strengths. The best choice is usually a hybrid path that fits how your top-site pages behave in both field and lab environments.
First, field-first analysis uses aggregated real-user datasets to identify failing pages and dominant contributors. This is powerful for prioritization because it shows where real users experience issues. However, it can struggle with root-cause precision if you cannot reproduce reliably in lab tests.
Second, lab-first deep dives focus on controlled testing to reproduce issues and isolate code-level causes. This is great for debugging LCP element timing, long tasks, and layout shift triggers. The limitation is representativeness. Lab conditions may not match the failing segment, especially on low-end devices or specific networks.
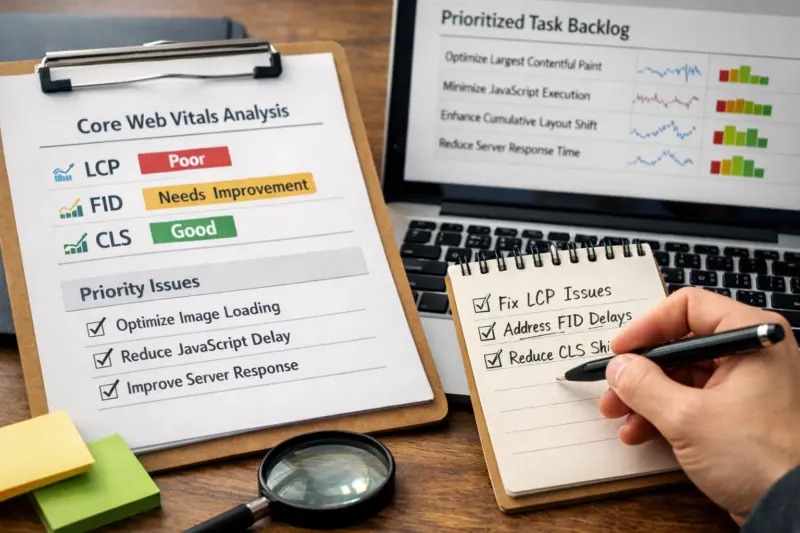
Third, hybrid workflows connect field signals to trace correlation. They use field data to pick scenarios, then lab runs to reproduce with trace alignment. This category is common for top websites because it balances prioritization and causality. It also reduces false confidence by forcing a connection between “where it fails” and “what causes it.”
Fourth, monitoring and automation approaches add regression detection to the workflow. They focus on catching changes after releases through targeted checks and alerting. This does not replace root-cause analysis, but it keeps improvements from slipping later.
Here is how those approaches compare:
| Approach | Best for | Tradeoffs | When top websites should use it |
|---|---|---|---|
| Field-first analysis | Finding which templates and segments fail | Root causes may be fuzzy without repro | When RUM coverage is strong and traffic is diverse |
| Lab-first deep dives | Debugging exact rendering and scripting behaviors | May not match real devices and networks | When you need fast causal isolation for LCP, INP, or CLS |
| Hybrid workflow | Triangulating field evidence with trace reproduction | More setup and coordination effort | When you must ship safe fixes with validated impact |
| Monitoring and automation | Regression prevention after releases | Cannot replace root-cause work | When teams release frequently and want stability gates |
Top sites also need to handle experiment-driven environments. Feature flags can make field data look like an average, even when failures exist only in one variant. Therefore, analysis tools and workflows must segment by variant where possible, so you do not smooth away the real issue.
If you want one external reference for metric definitions and how to measure them, start with Google’s guidance on Web Vitals and their measurement behavior: Web Vitals. It provides the baseline for aligning lab and field expectations.
Edge-case scenarios top websites must account for in Core Web Vitals Analysis
Top websites face edge cases that can skew Core Web Vitals signals. If you ignore these cases, you may blame the wrong component. A robust Core Web Vitals Analysis accounts for device, network, and dynamic content timing effects.
Device and network variability can concentrate failures. For example, LCP may be worse on slow connections due to resource download order. INP may be worse on low-end CPUs due to main-thread contention. Therefore, analysis should review segment breakdowns, not just one overall value.
Captive portals and unstable networks can also distort performance timing. In such cases, a page may load slowly and then recover, which affects how metric samples appear. Your validation plan should include representative network conditions when reproducing in lab tests, especially for key landing pages.
Dynamic content timing creates another set of edge cases. Late hydration, server/client rendering mismatches, and personalization can change when elements appear. That can shift LCP candidates or create CLS when markup changes after initial render. The analysis should identify which UI states are affected, such as pre-login vs post-login content.
Third-party dependencies are a frequent cause on top websites. Vendor scripts can dominate INP due to long tasks or heavy event handling. They can also cause CLS by inserting elements without reserving space. To isolate contribution, use a controlled containment strategy, such as temporarily disabling or delaying third-party bundles in staging, then validating both field and lab behavior.
Browser and platform differences also matter. Input event timing can differ based on browser execution and the event model behavior. If your lab setup uses a different browser than your main failing segment, your reproduction may be incomplete. Therefore, align browser choice and device class with field evidence.
Finally, threshold-shifting effects can invalidate old assumptions. Small UI changes, caching strategy updates, or CDN behavior can move the dominant contributor over time. That means a fix may appear to “stop working,” even if it still exists. The right response is to rerun the analysis after major changes, then update the hypothesis based on current contributor evidence.
Designing a measurement plan to validate Core Web Vitals improvements in 2026
A measurement plan should prove that improvements help real users, not just that dashboards look better. For top websites, validate Core Web Vitals improvements using clear success criteria and controlled experiments. In 2026, this is how you keep Core Web Vitals Analysis from turning into “score chasing.”
Define success beyond headline scores. Use contributor-level targets such as fewer sessions with late LCP element timing, fewer interactions dominated by long tasks, and fewer CLS shifts from specific elements. Also set stability goals across key segments, so improvements do not regress for a subset of devices.
Then run experiments safely. Use staging parity so the lab setup matches production behavior. Employ feature flags for targeted rollouts. This reduces risk because you can roll back quickly if the change impacts rendering, scripts, or user flow.
Your validation checklist should include before and after comparisons on the same page variants. Capture representative traffic and ensure that the “experience definition” is consistent. In addition, check for alignment between field and lab results. If lab improves but field does not, investigate whether the failing segment differs or whether sampling windows did not overlap properly.
Monitoring for regressions must be part of the plan. After release, watch for shifts in contributor patterns, not only metric totals. Consider automated checks tied to the templates and interactions that were originally failing. This helps catch cases where a later change reintroduces the root cause.
A deeper nuance involves sampling and attribution changes over time. Traffic mix can change due to campaigns, seasonal content, or new device distributions. When this happens, you should interpret improvements relative to segmented cohorts. Otherwise, you might conclude a fix failed when the problem audience moved away, or conclude a fix succeeded when the audience shifted.
For a durable measurement approach, define gates in your release workflow. A fix should pass verification gates tied to the metrics and the dominant contributors you targeted. This keeps engineering work tied to evidence, not opinions about what “should” improve.
How do I deliver Core Web Vitals Analysis insights to stakeholders across teams?
Core Web Vitals work succeeds when every team understands the same evidence and the same “what to do next.” A top website needs stakeholder-ready reporting, not just technical traces. Therefore, deliver insights in layers that engineering and SEO can both use.
Begin with an executive summary that is concrete. It should state which templates and segments fail, which metric is dominant, and what user friction it creates. Then follow with the evidence layer: session examples, trace correlations, and contributor breakdowns tied to UI elements. This separation helps reduce debate and keeps focus on actionable root causes.
Engineering stakeholders usually need more than a diagnosis. Provide the hypothesis, the affected code paths, and the expected mechanism of change. For example, if LCP is late due to render-blocking CSS, explain which assets or component boundaries you will adjust. Also include the instrumentation checks you used, so the analysis team can confirm that the metric computation reflects the real UX.
SEO stakeholders often need scope mapping. They care which search landing pages correspond to the failing templates and user journeys. Therefore, link the analysis scope to the page types that receive organic traffic. This prevents a common mistake where teams optimize internal pages while the external landing pages remain problematic.
Product and growth stakeholders need release safety and user journey impact notes. If a change affects consent flows, personalization, or navigation timing, explain how it might shift metrics attribution. Then define rollout plans and rollback criteria. This reduces the chance that performance improvements cause a behavioral change that harms conversions or perceived quality.

Another nuance is experimentation. Feature flags can create variant-specific failures that get averaged out in reports. So include variant awareness in your stakeholder updates when possible. That way, teams do not chase a “global” metric shift that is really a localized problem in one cohort.
To keep communication consistent, use a single shared “analysis artifact” format. It should list the metric, the dominant contributor, the hypothesis, the experiment, and the verification gate. When teams use the same format every time, you reduce time spent asking what “done” means.
What does “top websites” Core Web Vitals analysis typically deliver to engineering teams?
It delivers a prioritized list of failing templates and segments, tied to metric contributors like specific LCP elements or CLS shift sources. It also includes evidence such as representative real-user sessions and trace correlations. Finally, it provides an experiment plan with a verification gate that confirms the fix on the same experience and segment.
How do you connect field Core Web Vitals results to a specific code change?
You triangulate field observations with lab reproductions using aligned scenarios and trace evidence. Then you map dominant contributors to concrete UI mechanisms, like render-blocking resources or late layout-injecting scripts. Finally, you verify the change using before/after measurements in both field and lab for the same page variants.
Should we trust lab data more than real-user data when optimizing LCP and INP?
Real-user data is essential for understanding what users actually experience, especially across devices and networks. Lab data is stronger for isolating causes because it is repeatable. The best practice is to use lab data to debug, then validate in field data after rollout.
Why do my improvements show in testing but not in real-user metrics?
Often, the lab scenario does not match the failing segment, such as a different device class or interaction path. Another reason is rollout timing, where field samples have not fully stabilized yet. Instrumentation gaps can also distort comparisons if the experience boundaries or lifecycle markers differ.
How can I analyze CLS caused by third-party embeds without breaking layout for users?
Isolate the embed’s layout behavior by identifying CLS shift sources and reproducing the embed timing in staging. Then contain impact by reserving space for the embed container or loading it in a controlled way that avoids late insertion. Verify with layout shift evidence that the shifts from that embed drop, while other CLS sources do not increase.
What’s the best way to prioritize Core Web Vitals fixes when multiple metrics are failing at once?
Start with which templates and segments fail most and identify the dominant contributors per metric. Then score each candidate fix by user impact, difficulty, and the confidence from evidence. Handle tradeoffs by tracking how experiments may affect other metrics, such as CSS changes improving CLS but increasing main-thread work.
Which Core Web Vitals scenarios should be tested on the homepage versus templates and article pages?
Test the homepage for overall funnel entry, but also test every key template that drives organic and returning traffic. This includes listing pages, article pages, and any logged-in or consent-gated states that alter rendering. Dominant contributors often differ by template, so scope selection must follow real traffic and user journeys.
How do A/B tests and feature flags affect Core Web Vitals analysis and validation?
Feature flags can create variant-specific failures, so segment results by experiment cohort when possible. During validation, ensure your before/after comparison uses the same variant logic and experience definition. Otherwise, you can misattribute changes to a fix when they are caused by a variant rollout or traffic mix shift.
What data do you need to perform a reliable Core Web Vitals analysis if you don’t have strong RUM coverage?
You can still proceed with lab reproduction, but you need a plan to add or improve instrumentation. Capture detailed traces, record layout shift sources, and validate interaction types that align with your real user journeys. Then run a staged sampling plan so you can gradually build RUM confidence and reduce guesswork.
How often should we rerun Core Web Vitals analysis for a production website in 2026?
Rerun the analysis after major releases, template changes, or third-party updates that could alter rendering and scripting. Also rerun it when dashboards show regressions or when experiment-driven variants change user experiences. For ongoing work, combine targeted contributor monitoring with periodic deep dives for key templates.
Conclusion: turn Core Web Vitals signals into validated engineering actions
A Core Web Vitals analysis for top websites should convert signals into prioritized, testable engineering actions with validated outcomes. The loop must be field to lab, then root-cause evidence to experiment, and finally measurement confirmation that matches the same experiences. If you focus on dominant contributors and page scope, you avoid chasing vanity changes.
To keep improvements durable, start with the highest-impact pages and the dominant contributors driving LCP, INP, and CLS. Then build a repeatable measurement plan that prevents regressions and respects experiment-driven environments. This is how Core Web Vitals work stays aligned with real user experience, not just dashboards.
Your next steps are practical. Audit key templates and navigation flows, set up a hybrid workflow that connects field and trace evidence, and run controlled experiments with verification gates. This approach is the simplest path to turning Core Web Vitals Analysis into measurable UX improvements in 2026.
Updated September 2026