

To get better user experience insights, you should monitor what real visitors do, how the site behaves on different networks and devices, and where errors or delays actually happen. Using website performance monitoring tools, you can turn raw timing and reliability data into clear decisions like what to fix first and whether a change helped. The goal is fewer failed sessions, smoother journeys through key steps, and less guesswork during troubleshooting. In 2026, that requires more than one “speed score.” Monitoring also means observing real-user behavior and technical signals together so you can connect symptoms to causes.
Contents
- 1 Turn performance data into user experience decisions
- 2 Use real-user monitoring and synthetic checks as complementary sources
- 3 Monitor core UX signals that map to what users feel
- 4 Look beyond averages by using distributions and trends
- 5 Cover infrastructure and networking signals that often cause “mystery slowdowns”
- 6 Instrument events that connect performance to conversion and retention steps
- 7 Use RUM dashboards, synthetic monitoring, and APM-style observability together
- 8 Evaluate monitoring tools using measurement coverage, alerting quality, and correlation
- 9 Avoid common monitoring pitfalls that cause misdiagnosis
- 10 Follow a root-cause workflow that spans frontend, backend, and logs
- 11 Choose the right monitoring setup for small sites, growing teams, and enterprises
- 12 Align monitoring with hosting, compliance, and team operations in 2026
- 13 Compare tool categories by effort, blind spots, and typical failure modes
- 14 Frequently asked questions about website performance monitoring tools for better insights
- 14.1 What’s the difference between real user monitoring and synthetic website checks?
- 14.2 Which performance metrics should I track for user experience—not just speed?
- 14.3 How do I choose baselines and alerts without creating constant noise?
- 14.4 Can one tool replace RUM if I only care about performance scores?
- 14.5 How long does it take to set up website performance monitoring tools properly?
- 14.6 What should I do when synthetic tests look fine but users report slowdowns?
- 14.7 How do I connect performance monitoring data to specific code changes or releases?
- 14.8 Are session replay tools helpful for performance monitoring, or do they distract teams?
- 14.9 What are the most common measurement mistakes that lead to wrong conclusions?
- 14.10 Do I need different monitoring for mobile versus desktop experiences?
- 14.11 How can I monitor third-party scripts and services without drowning in data?
- 15 Use an incremental rollout to get better insights fast
- 16 Tool categories to consider when building your monitoring stack
Turn performance data into user experience decisions
Performance monitoring only matters if it changes what you do next. “Better insights” should translate into prioritized work, verified outcomes, and faster detection of regressions. For example, if a checkout step slows down, the data should tell you whether the issue is images, scripts, backend latency, or third-party behavior. Then you can test a fix and confirm it improved the journey for real visitors.
To build this decision loop, map monitoring targets to user experience outcomes. Focus on journeys like search-to-results, add-to-cart, login, and post-purchase pages. Also include key templates, such as product pages or article pages that drive traffic. Homepages alone can hide the real problems, because many users never follow that single path.
Most teams need two data types to reach actionable conclusions. Real User Monitoring (RUM) shows how actual visitors experience your site. Synthetic checks run controlled tests on a schedule, which helps you detect changes over time. When you combine them, you can separate “it happens to some users” from “it broke at a specific time.” That pairing reduces false alarms and prevents missed incidents.
Sampling and attribution deserve attention early, because weak setups create false confidence. If you only track high-traffic pages, low-traffic but critical pages can fail silently. If you do not segment by device, region, or plan tier, you may misread what changed. For instance, a marketing campaign can shift traffic mix, making performance appear worse even when code did not regress.
Use real-user monitoring and synthetic checks as complementary sources
Real User Monitoring and synthetic monitoring answer different questions, so they should not compete. RUM tells you what happened to people who visited your site. Synthetic checks tell you what happens in a repeatable environment when you run the same test from the same type of browser.
RUM typically uses client-side collection to measure timing breakdowns, errors, and interactions. It can also segment by device, browser, geography, and traffic source. This helps you see patterns like “slow on mobile Safari in one region” or “timeouts after a specific redirect.” Practical application means you can watch whether fixes improve actual conversion steps, not just page load metrics.
Synthetic monitoring works best for scheduled regression detection and availability checks. It also helps you validate that a change actually improved a known journey. In practice, you run tests on key URLs such as the login flow, checkout start, and search results rendering. When a test fails, you get a starting point to investigate before users file complaints.
However, each has limitations. RUM can miss issues if sampling is too low or instrumentation is wrong. Synthetic tests can “pass” while real users still struggle due to network variability or ad-script timing. A common misconception is that one source alone is enough. The edge case is intermittent failure like third-party throttling, which might show in synthetic at first, then vanish. Combining sources lets you confirm whether it affects users in the same window.
Monitor core UX signals that map to what users feel
Your monitoring setup should focus on signals tied to user experience, not just a single score. The best insights reflect what users notice: delays, unresponsive UI, failed requests, and confusing errors. When those signals align with user journeys, you can fix the right bottleneck instead of chasing vanity metrics.
Start with load timing breakdowns, such as when content appears and when the page becomes interactive. Then monitor responsiveness signals, like long tasks that block the main thread. Add error rates for both JavaScript errors and failed network requests. Also track resource-level bottlenecks, such as slow images or heavy third-party scripts that block rendering.
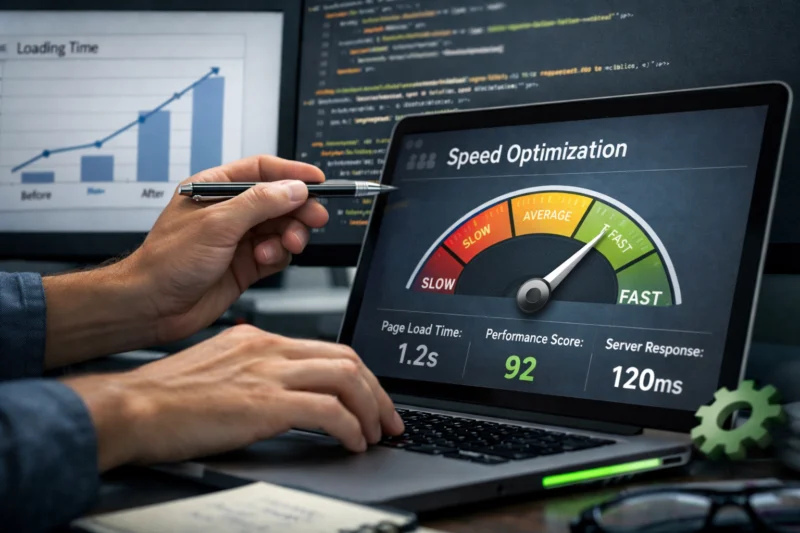
In addition, you need to observe infrastructure effects that users feel. DNS and TLS negotiation delays can stretch early connection time. CDN behavior and caching effectiveness impact whether repeat visits load quickly. Server latency and throughput limits can increase “time to first byte,” especially under load. Practical application means you separate client-side delays from server-side delays using the waterfall and trace data your tool produces.
It also helps to instrument events that represent meaningful actions. For example, track “search results rendered,” “add-to-cart clicked,” and “checkout step completed.” These events connect performance to outcomes. A common mistake is measuring only page view timing while ignoring action latency. In real incidents, users can bounce after interacting, even if the page “loads.”
Look beyond averages by using distributions and trends
Average performance hides the real user experience, especially when only a subset is affected. To get better insights, monitor distributions such as p75 and p90. Those percentiles show what most users feel and what your worst cases endure.
Trends matter just as much as snapshots. Averages can drift slowly while percentiles jump suddenly due to a release, a cache change, or a third-party update. For instance, one release might not change the median at all, while p90 worsens due to a slow code path only some browsers hit. Therefore, you should compare trends by journey and segment, not only by overall site averages.
Practical application means you set baselines per template and per key journey step. Then you watch how those baselines behave across device classes and network conditions. In 2026, many teams also track “error rate percentiles” alongside latency percentiles to avoid trading one for the other. A fast page that errors is still a broken experience.
One edge case is traffic mix changes. If you launch a new campaign, you may attract more mobile users or regions with different network quality. This can change distributions without any code changes. A common misconception is to blame deployments every time performance moves. Instead, verify whether traffic mix and segmentation explain the shift.
Cover infrastructure and networking signals that often cause “mystery slowdowns”
Many user-visible slowdowns come from networking and infrastructure, not just page code. If your monitoring ignores connection and edge behavior, you can misdiagnose issues and waste engineering cycles. Better insights require seeing how requests travel from the browser to the CDN edge and back to origin.
Track connection timing signals like DNS lookup, TCP setup, TLS handshake, and time to first byte. Then add CDN-specific observations such as cache hit ratio and cache miss behavior. Also monitor server latency, backend response time, and any queueing that increases wait time under load. Practical application means you can tell whether delays start before the application even runs.
Caching effectiveness deserves extra attention. If caching headers change, you can turn a fast repeat visit into a slow origin fetch. Similarly, CDN configuration can impact compression, edge rendering, or how redirects are handled. When monitoring shows a sudden rise in origin latency or cache misses, you can quickly focus your investigation.
There is a nuance in interpretation. Client-side timing can look like “render slowness,” while the root cause is slow backend data retrieval. Therefore, use resource-level details and, when possible, tracing to connect frontend phases to backend spans. A common mistake is optimizing UI updates while the real bottleneck is a slow API call.
Instrument events that connect performance to conversion and retention steps
To improve user experience, you need monitoring that ties performance to meaningful behavior. That means instrumenting not only page loads but also user actions that represent progress through a journey. When your tools capture these events, you can quantify how performance affects outcomes.
Begin with a small set of events that map to business-critical steps. Examples include product page view, search query submitted, results displayed, add-to-cart, checkout started, login completed, and confirmation page reached. Track these with consistent naming and versioning so you can compare across releases. Then connect event timestamps to timing breakdowns.
Practical application looks like this: if “search results displayed” becomes slower, check the waterfall for API response time and the resource list for heavy scripts. If “checkout started” fails, inspect client errors and failed requests. If “login completed” increases latency, correlate with backend authentication spans. This reduces guesswork because the monitoring data points to a specific journey phase.
However, event instrumentation can create its own blind spots. If you only fire events on successful paths, you miss where users drop off. If you ignore failures, you can “improve speed” while making errors worse. A common misconception is that fewer page-load errors means everything is fine. In reality, users can experience timeouts or stalled UI without triggering visible page errors.
Use RUM dashboards, synthetic monitoring, and APM-style observability together
The top tool categories work best as a system, not as a single replacement. Real User Monitoring dashboards reveal how users experience your site in the wild. Synthetic monitoring catches regressions and availability issues early. Full-stack observability combines frontend telemetry with backend tracing and application monitoring.
RUM tools usually focus on client performance metrics, error tracking, and segmentation. They help you answer questions like “who is affected and when.” Synthetic tools focus on repeatable tests across browsers, locations, and device profiles. They help you detect “it broke” signals even if user traffic is low.
APM and distributed tracing tools connect frontend events to backend spans. This category helps teams pinpoint slow API calls, slow database queries, and third-party delays tied to page phases. Log and incident tools support operational workflows by aggregating events, alerting, and status. Browser and session replay platforms can also provide qualitative context, such as why users cannot complete a step.
Each category has tradeoffs. RUM requires correct instrumentation and careful sampling. Synthetic checks increase maintenance because test scripts must stay aligned with your UI changes. Tracing can be expensive if you collect too much or forget to sample. Hybrid setups reduce blind spots, so many teams use synthetic for early detection while relying on RUM for impact confirmation.
Evaluate monitoring tools using measurement coverage, alerting quality, and correlation
You should evaluate tools based on whether they help you make better decisions, not just whether they show graphs. A strong evaluation framework compares measurement coverage, alerting quality, drill-down depth, and how reliably the tool correlates signals to changes.
Start with coverage. Does the tool measure UX-relevant signals across the journeys you care about? Does it capture errors, resource waterfalls, and backend timing when needed? Next, assess alerting quality. Good alerting reduces noise and uses baselines and thresholds tied to user impact, not only to technical metrics.
Then check correlation and drill-down. When an alert fires, can you jump from an impacted journey to the likely cause? Can you correlate performance changes with release events, deployments, and specific service spans? Data controls also matter. You need retention options, sampling controls, and the ability to manage high-volume telemetry without losing important signals.

Onboarding reality is another factor in 2026. It can take weeks to instrument events correctly and establish baselines per template. Therefore, run a proof-of-value. Import an existing dashboard or test a representative subset of traffic. Validate timelines and build a root-cause workflow that your team can follow.
A deeper insight you should demand is proof of correlation guidance. Ask how the vendor supports linking user-impact metrics to code changes, using release annotations and deployment integrations. A common mistake is relying on parallel charts without a workflow to confirm cause. Correlation features can be misleading if you cannot trace the chain from user symptom to the affected service.
Avoid common monitoring pitfalls that cause misdiagnosis
Many teams misdiagnose performance because their monitoring setup gives them the wrong confidence. The fix is not “more dashboards.” It is better measurement design and better interpretation across sources.
One pitfall is optimizing for synthetic scores without confirming user impact. Synthetic tests can pass while real users still face slowdowns due to network variability, device differences, or third-party timing. Therefore, pair synthetic and RUM and check the outcome for each journey step. Then validate that the issue affects real conversion paths, not only a test script.
Another pitfall is alert fatigue from noisy thresholds. If alerts trigger too often, teams will ignore them. Use baselines, seasonality, and severity tied to user experience impact. For example, a small increase in early connection time might not deserve a pager, while a jump in “checkout step completed” failures should.
Correlation mistakes also happen frequently. A deploy can coincide with slower responses, but it may not be the cause. Use release annotations, tracing, and controlled experiments when possible. Also remember content and traffic mix shifts. New landing pages, new marketing campaigns, or a device mix change can make performance look worse without code regressions.
Follow a root-cause workflow that spans frontend, backend, and logs
When an anomaly appears, you need a structured workflow to avoid random investigations. The best monitoring tools support a repeatable path: detect the issue, segment the affected users, inspect resource-level clues, and confirm with backend evidence. That process turns alerts into actionable outcomes.
First, detect anomalies using thresholds and trends on your key journeys. Next, segment by device, region, and channel so you can narrow the scope. Then inspect the resource waterfall and client-side timing breakdowns to identify the slow phase. For example, you may see a delay in API response time or a spike in blocked requests from third-party scripts.
After that, correlate to backend spans and logs. Traces help you locate slow components like APIs, database queries, or third-party calls. Then confirm with recent releases or configuration changes. In multi-CDN and multi-region setups, also verify cache behavior and origin routing, since sudden cache misses can shift load to the origin.
Edge cases require extra care. In single-page applications, client-side rendering delays can mimic server slowness. Long tasks can hurt responsiveness without changing load timing much. Intermittent issues can also disappear during replays, so use time-window comparisons and cluster errors by signature. A nuance is sampling bias in replay or tracing; if you do not sample carefully, you may miss the exact failure mode.
Choose the right monitoring setup for small sites, growing teams, and enterprises
Your best tool mix depends on team size, engineering maturity, and risk tolerance. A small site needs fast visibility and a short path from symptom to fix. A growing site needs regression coverage and a clearer link between frontend performance and backend behavior. An enterprise needs governance, broad correlations across services, and operational scale.
For a small team, start with essential RUM plus lightweight alerting and error monitoring. Limit scope to two or three key user journeys. This keeps instrumentation manageable and makes dashboards readable. Then add synthetic checks for critical availability and basic regression coverage. The tradeoff is reduced depth in backend attribution, but you gain speed in day-to-day decisions.
For a growing site, add synthetic regression coverage for key flows and integrate basic APM or tracing. This helps connect frontend timing to backend services. Also build a repeatable workflow for investigating alerts. In practice, teams often begin with tracing on the most critical APIs and expand as they prove value.
For enterprise teams, implement observability correlations across services and advanced segmentation. Add custom alert routing, broader data governance, and stronger audit controls. You also need retention policies that support diagnosis without excessive cost. A budget-to-impact mapping helps : increasing measurement coverage improves decision speed, while adding deep tracing improves root-cause accuracy.
Align monitoring with hosting, compliance, and team operations in 2026
Performance monitoring works best when it reflects how your site actually runs. Hosting, CDN, edge rendering, and caching layers shape user-perceived speed. Therefore, you should verify the monitoring signals against your environment so the data you trust matches real behavior.
Start with hosting and CDN realities. Confirm what is cached, what is rendered at the edge, and what hits the origin. Then ensure your monitoring captures those differences in signals like cache hit ratio and origin latency. If your site uses multiple regions, validate that your tool can segment by region and network path. That prevents chasing the wrong bottleneck.
Privacy and compliance boundaries also matter. Avoid over-collecting personal data in instrumentation. Use privacy-safe identifiers and collect the minimum needed to diagnose performance. Many teams also separate technical telemetry from any user content data and define retention windows for each category. This reduces risk and simplifies governance reviews.
Operational readiness completes the loop. Build escalation workflows and runbooks so alerts lead to action. Integrate monitoring with CI/CD deploy events so performance changes have context. Also plan data retention and reprocessing. You may need to revisit baselines after a configuration change, and you should be able to reproduce the analysis window.
Compare tool categories by effort, blind spots, and typical failure modes
Choosing among website performance monitoring tools gets easier when you compare categories by effort and blind spots. One category rarely covers everything. The goal is to cover UX impact, detect regressions early, and identify causes quickly.
RUM dashboards often have moderate setup effort. You must add or enable instrumentation, define events, and verify sampling. Their blind spot is that issues can be hard to reproduce in controlled tests. Synthetic monitoring setup also takes time, since you must maintain scripts across UI changes. Its blind spot is “false certainty” when real-world networks differ from the test environment.
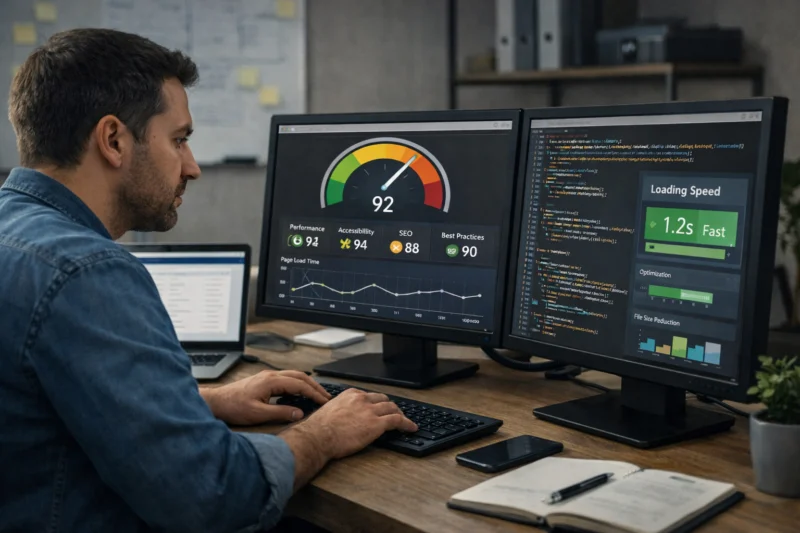
Full-stack observability with tracing can require deeper engineering work. You need instrumentation on backend services and consistent trace propagation. Its blind spot is cost and sampling complexity if you collect too much telemetry. Log and incident tools typically integrate faster but can overload teams if they do not support correlation and drill-down. Session replay adds qualitative detail, but it can distract teams if you do not tie replays to specific alerts and journey phases.
In practice, hybrid setups reduce blind spots. Synthetic can show that a journey regressed after a deployment. RUM can confirm whether real users experienced the same issue. Tracing can then reveal which backend spans caused the delay. A common mistake is adopting one tool category deeply while skipping the others. That leads to either missed impact or slow root-cause workflows.
Frequently asked questions about website performance monitoring tools for better insights
What’s the difference between real user monitoring and synthetic website checks?
Real user monitoring captures how actual visitors experience your site, including timing, errors, and interaction outcomes. Synthetic checks run controlled tests on a schedule, often from specific browser and location profiles. RUM can prove user impact, while synthetic can catch regressions earlier. Use them together to avoid missing issues that only appear under real network conditions.
Which performance metrics should I track for user experience—not just speed?
Track timing breakdowns that reflect when users can perceive content and when the page becomes responsive. Include responsiveness signals like long tasks, plus error rates for failed requests and client errors. Also track resource-level bottlenecks such as slow images or third-party scripts. Finally, connect performance to UX events like add-to-cart and checkout step completion.
How do I choose baselines and alerts without creating constant noise?
Use distributions like p75 or p90 for your key journeys, not only averages. Set baselines per template and segment by device or region so seasonality and traffic mix shifts do not trigger false alarms. Then tie alert severity to user impact, such as an increase in failed checkout completions. Test alerts on a real traffic subset before rolling them out broadly.
Can one tool replace RUM if I only care about performance scores?
No single-source setup usually replaces RUM because synthetic scores cannot reflect real network variability. Even reliable synthetic tests can miss issues caused by specific devices, browsers, or traffic mix. If you only monitor performance scores, you risk optimizing for what the test measures, not what users experience. You need RUM to confirm whether the problem affects actual journeys and outcomes.
How long does it take to set up website performance monitoring tools properly?
In 2026, setup time varies by instrumentation depth and how many journeys you track. For a basic RUM and error setup, many teams can get value in days to a couple of weeks. Full event instrumentation and baseline establishment often take longer because you must validate event accuracy and build stable thresholds. You should plan for at least a few weeks of testing and tuning on representative traffic.
What should I do when synthetic tests look fine but users report slowdowns?
Start by segmenting RUM by device, region, and browser to find the affected group. Then inspect network waterfalls and resource breakdowns for the slow phase during the reported window. Next, correlate the issue to any recent releases and check backend traces if those signals point to server timing. Finally, review third-party script behavior, since synthetic tests may not replicate the same load conditions.
How do I connect performance monitoring data to specific code changes or releases?
Use release annotations and deployment integrations so every monitoring event is linked to a time window and version. Then use tracing to connect slow spans to the specific services touched by the release. Logs can add context when tracing highlights the affected component. The key detail is proving that user impact changes align with the release, not just coinciding charts.
Are session replay tools helpful for performance monitoring, or do they distract teams?
Session replay tools can help when you need qualitative context, such as why users cannot complete a step. They work best when you trigger replays from specific alerts or error spikes tied to a journey. However, replays can distract teams if they generate too many unsorted sessions. Also consider privacy boundaries and only collect what you need to diagnose performance and UX issues.
What are the most common measurement mistakes that lead to wrong conclusions?
Common mistakes include missing key instrumentation events, using low sampling that hides the affected user group, and mis-segmenting by device or region. Another error is confusing correlation with causation when a deploy happens to coincide with a performance dip. Teams also overlook traffic mix changes, like new campaigns shifting device or geography. Finally, ignoring failed requests and errors can make symptoms look like “only slow pages.”
Do I need different monitoring for mobile versus desktop experiences?
Yes, mobile experiences often differ due to CPU throttling, network variability, and browser engine behavior. You should segment by device class and track responsive and long-task signals that map to interactivity. Also monitor that your tool’s segmentation and waterfalls reflect mobile-specific loading patterns. Otherwise, you can optimize desktop metrics while users struggle on mobile.
How can I monitor third-party scripts and services without drowning in data?
Scope the third-party signals to what affects user experience, such as increased errors, blocked requests, and delayed render phases. Isolate third-party impact by tagging requests and tracking bottleneck resources tied to key journey steps. Then set guardrails so alerting focuses on meaningful changes, not every noisy variation. This keeps the data actionable while still revealing third-party delays.
Use an incremental rollout to get better insights fast
Start simple and expand once you can prove decisions improved. First, define the journeys your team cares about and the UX steps that matter. Then collect RUM and synthetic signals for those journeys, plus technical signals like resource waterfalls and backend timing where possible. This gives you a practical baseline and a fast feedback loop.
Next, evaluate tool categories using an evidence mindset. Can you segment impact by user groups? Can you correlate user-impact changes to releases? Can you drill down from a symptom to a likely cause with tracing or logs? Compare categories by effort and blind spots, and then choose the smallest setup that covers your top risks.
Finally, avoid the common failure paths: optimizing synthetic scores only, creating noisy alerts, and chasing coincidental timelines. In 2026, the teams that win build a consistent root-cause workflow and document it in runbooks. Your next step should be to implement a baseline, set 2–3 user-impact alerts, and document a root-cause workflow. Then run a short proof-of-value on a real site segment before you expand monitoring coverage.
If you want official guidance on what to measure for modern web performance and why user experience matters, review Google Web.dev and W3C Web Performance references for standards and performance concepts. For security and privacy considerations around web measurements, you can also consult resources from U.S. National Institute of Standards and Technology on privacy and measurement practices.
Tool categories to consider when building your monitoring stack
A practical monitoring stack combines multiple categories so you can see both impact and cause. RUM dashboards provide the real visitor view and help you segment by device, geography, and traffic patterns. Synthetic monitoring adds scheduled regression detection and availability checks. Full-stack observability links frontend behavior to backend services using traces.
Log and incident tools support operational workflows like grouping errors and routing alerts to the right people. Browser and session replay platforms add qualitative detail when you need to understand what users saw and did. When you choose categories together, you reduce blind spots that happen when only one data source exists. For example, synthetic can detect a regression, but RUM proves whether users experience it.
Before you commit, evaluate onboarding effort and failure modes. Ensure the tool captures the UX-relevant signals you care about, and confirm that events map to journey steps. Also confirm retention and sampling controls so you can manage data volume. Finally, validate that you can correlate alerts to releases with deployment tracking and release annotations.
For additional context on how different performance measurements relate to user experience, you can also reference Google’s Core Web Vitals documentation for field-oriented performance concepts and how they connect to UX goals.
Updated September 2026